
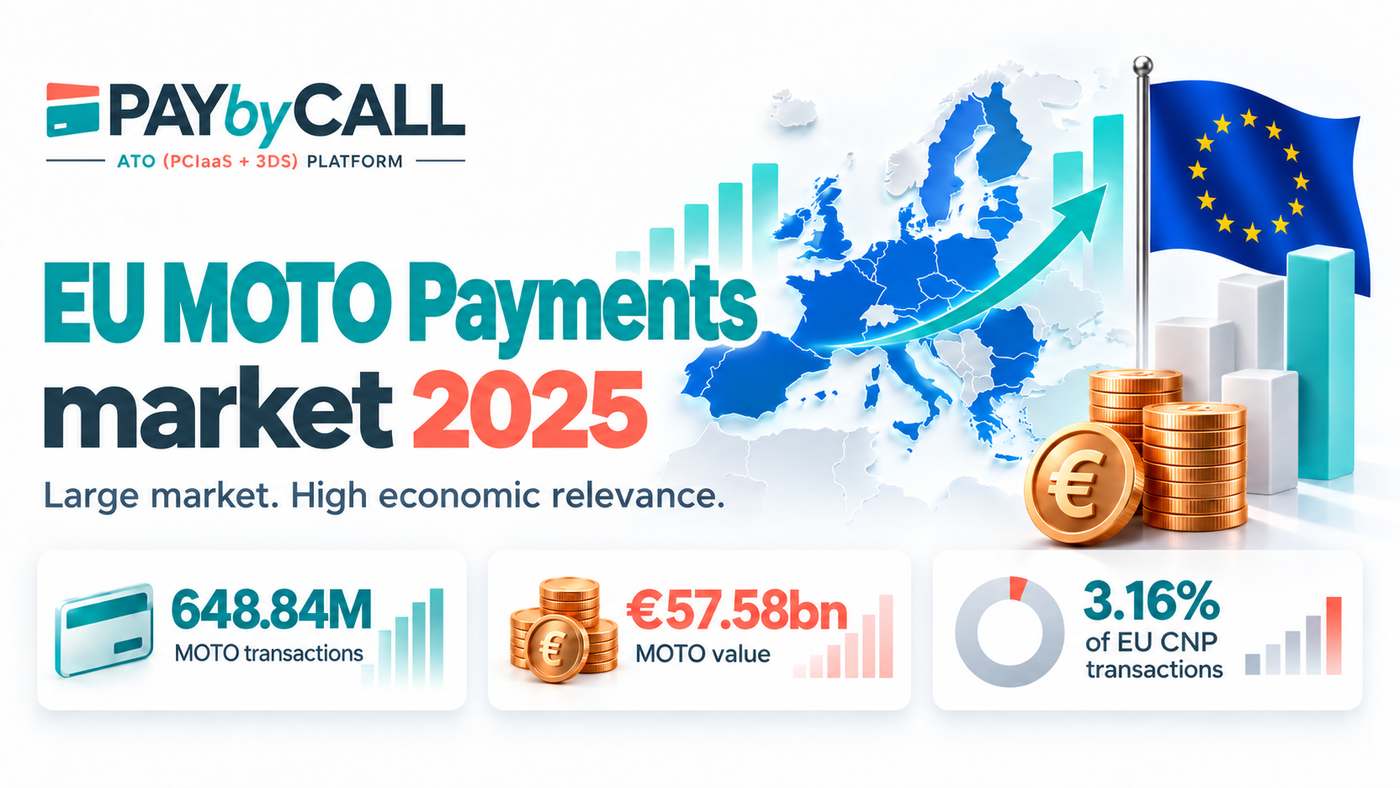
In 2025, the official EU aggregate recorded 648.836 million MOTO transactions worth €57.576 billion. MOTO is losing share as electronically initiated remote payments grow rapidly, but it remains a large and economically significant part of Europe’s card-not-present ecosystem.
EU MOTO market — 2025 official aggregate (W0.W0)
648.836 million transactions · €57.576 billion in value · 3.16% of CNP transactions · 4.81% of CNP value · €88.74 average MOTO ticket.
Why this study matters
MOTO — Mail Order / Telephone Order — is still present across many European payment journeys, yet it is rarely analysed as a market in its own right. The relevant data exists within the European payments statistics, but it is dispersed across series, statistical dimensions and country-level observations rather than presented as a single market view.
Pay by Call therefore analysed the official European data for 2024 and 2025, country by country, using the conceptual selection provided by the Statistical Information Service of the Bank of Spain and the underlying series published by the European Central Bank. The objective was to answer a broader European question: how large is the MOTO market, how does it differ across countries, and how much does the chosen statistical perimeter change the picture?
The result is a market view that covers transaction volumes, values, MOTO/CNP shares, average tickets and the difference between the strictly domestic scope W2.W2 and the broader worldwide issuer scope W0.W0.
1. Two statistical scopes — and why they must not be mixed
The first lesson is methodological. W2.W2 and W0.W0 answer different questions. W2.W2 is useful for analysing the strictly domestic circuit. W0.W0 is broader: it follows cards issued by resident payment service providers even when the counterparty, merchant or point of sale is abroad.
Two complementary statistical scopes
How W2.W2 and W0.W0 should be interpreted
| Scope | What it includes | Best use | Main limitation |
|---|---|---|---|
| W2.W2 | Domestic counterparty and domestic point of sale | Analyse the strictly national circuit | Excludes cross-border activity associated with cards issued in the country |
| W0.W0 | Any counterparty and point of sale in any country | Approximate the worldwide market associated with cards issued by resident PSPs | Does not measure acquiring or all sales by merchants located in the country |
For country comparisons, the denominator matters. A country may look relatively small under W2.W2 simply because a large share of the activity associated with its issued cards occurs cross-border. Conversely, a strong domestic ratio does not automatically mean a larger worldwide market.
2. What MOTO means in the ECB dataset
In the statistical framework used in this study, MOTO corresponds to remote payments not initiated electronically (channel 1000, remote R). Electronically initiated remote payments use channel 2000. For this analysis, total card-not-present (CNP) activity is the sum of those two remote categories.
One limitation is especially important: the MOTO classification does not separate mail order from telephone order. It also does not identify whether a telephone payment is agent-assisted, IVR-based, AI voice-based or follows another voice journey. Nor does the dataset, by itself, indicate authentication, fraud, chargebacks or SCA status.
3. The EU aggregate: a €57.6 billion MOTO market
The official EU aggregate recorded 648.836 million MOTO transactions in 2025, with a total value of €57.576 billion. Compared with 2024, MOTO transactions fell by 2.27% and MOTO value by 5.35%.
At the same time, electronically initiated remote payments grew sharply: +15.86% in transaction count and +17.89% in value. Total CNP activity therefore expanded strongly, while MOTO’s relative share declined.
Official EU aggregate
Worldwide W0.W0 scope; second half of 2025 is provisional
| Indicator | 2024 | 2025 | Change |
|---|---|---|---|
| MOTO transactions (million) | 663.895 | 648.836 | -2.27% |
| MOTO value (€ million) | 60,828.766 | 57,576.188 | -5.35% |
| Electronically initiated remote transactions (million) | 17,165.245 | 19,887.604 | +15.86% |
| Electronically initiated remote value (€ million) | 966,291.432 | 1,139,186.693 | +17.89% |
| Total CNP transactions (million) | 17,829.140 | 20,536.440 | +15.18% |
| Total CNP value (€ million) | 1,027,120.198 | 1,196,762.881 | +16.52% |
| MOTO share of CNP transactions | 3.72% | 3.16% | -0.56 pp |
| MOTO share of CNP value | 5.92% | 4.81% | -1.11 pp |
| Average MOTO ticket | €91.62 | €88.74 | -3.15% |
The key point is that declining share is not the same as disappearance. MOTO represented 3.16% of EU CNP transactions in 2025, but 4.81% of CNP value. Its economic weight is therefore proportionally larger than its transaction-count share.
The average MOTO ticket across the EU was €88.74 in 2025. Using the same official aggregate, the implied average ticket for electronically initiated remote payments is about €57.28. This is one reason why exposure should not be assessed only by counting transactions.
4. Europe is not one MOTO market: country structures differ substantially
The country-level data shows a highly heterogeneous market. Under W0.W0, the largest published markets by transaction count in 2025 were Italy (169.752 million), France (169.038 million) and Spain (89.580 million), followed by Portugal, Ireland and Germany.
By value, the order changes. Ireland (€13.181 billion) and France (€12.472 billion) lead the published country figures, followed by Spain (€8.363 billion), Italy (€8.035 billion) and Germany (€6.982 billion). Ireland’s figures are unusual relative to the size of the country and should be interpreted cautiously because its domestic series are incomplete.
The ratios also tell different stories. In 2025, MOTO accounted for 10.52% of CNP transactions in Italy, 7.10% in Croatia, 6.82% in Portugal, 3.76% in Ireland, 3.62% in Spain, 3.59% in France and 2.02% in Germany under W0.W0. By value, the relative exposure is different again: 10.99% in Ireland, 8.97% in Italy, 6.72% in Spain, 6.47% in Portugal, 5.22% in Germany and 4.43% in France.
That variation matters. Volume, market share and average ticket measure different phenomena. No single metric is sufficient on its own.
5. Average ticket: where economic exposure becomes visible
Average MOTO ticket values vary widely across the EU. In the W0.W0 dataset for 2025, Ireland reaches €336.16, Lithuania €205.92, Austria €198.20, Germany €190.24, Slovenia €171.79, Czechia €145.43 and Cyprus €137.02. At the other end, markets such as Slovakia, Finland, Croatia, Latvia, Belgium and Poland show much lower average tickets.
This reinforces a crucial point for risk, acquiring and regulatory analysis: a market with fewer MOTO transactions can still have a high economic exposure per transaction.
6. Full EU country tables — domestic scope W2.W2
The domestic view measures transactions where the counterparty and point of sale are domestic. It is valuable for understanding national circuits, but it does not capture the full market associated with cards issued in each country.MOTO transactions by country
MOTO transactions by country
Domestic scope W2.W2 · million transactions · 2024 vs 2025
| Country | 2024 | 2025 | Change 2025/24 |
|---|---|---|---|
| Germany | 6.086 | 5.639 | -7.35% |
| Austria | 0.946 | 0.732 | -22.69% |
| Belgium | N/A | 0.142 | N/A |
| Bulgaria | N/A | N/A | N/A |
| Czechia | 0.041 | 0.042 | +1.68% |
| Cyprus | N/A | 0.141 | N/A |
| Croatia | 6.974 | 7.979 | +14.40% |
| Denmark | N/A | N/A | N/A |
| Slovakia | 0.081 | 0.088 | +8.52% |
| Slovenia | 0.000 | 0.000 | N/A |
| Spain | 64.726 | 59.725 | -7.73% |
| Estonia | 0.008 | 0.016 | +87.48% |
| Finland | 0.723 | 0.417 | -42.26% |
| France | 79.659 | 67.143 | -15.71% |
| Greece | 3.002 | 3.109 | +3.57% |
| Hungary | 2.692 | 2.899 | +7.69% |
| Ireland | N/A | 15.965 | N/A |
| Italy | 35.984 | 34.786 | -3.33% |
| Latvia | N/A | N/A | N/A |
| Lithuania | N/A | 0.026 | N/A |
| Luxembourg | 0.532 | 0.182 | -65.80% |
| Malta | N/A | N/A | N/A |
| Netherlands | N/A | N/A | N/A |
| Poland | 8.697 | 7.241 | -16.74% |
| Portugal | 8.755 | 7.292 | -16.71% |
| Romania | 0.017 | 0.014 | -16.20% |
| Sweden | N/A | N/A | N/A |
MOTO value by country
MOTO value by country
Domestic scope W2.W2 · € million · 2024 vs 2025
| Country | 2024 | 2025 | Change 2025/24 |
|---|---|---|---|
| Germany | 2,759.446 | 2,601.933 | -5.71% |
| Austria | 232.312 | 198.037 | -14.75% |
| Belgium | 41.679 | 23.469 | -43.69% |
| Bulgaria | N/A | N/A | N/A |
| Czechia | 8.142 | 7.536 | -7.44% |
| Cyprus | N/A | 18.928 | N/A |
| Croatia | 218.085 | 269.244 | +23.46% |
| Denmark | N/A | N/A | N/A |
| Slovakia | 1.899 | 1.760 | -7.32% |
| Slovenia | 0.000 | 0.000 | N/A |
| Spain | 6,541.528 | 6,302.672 | -3.65% |
| Estonia | 0.141 | 0.667 | +373.71% |
| Finland | 28.435 | 15.806 | -44.41% |
| France | 11,655.032 | 8,622.929 | -26.02% |
| Greece | 289.951 | 295.975 | +2.08% |
| Hungary | 87.332 | 90.374 | +3.48% |
| Ireland | N/A | N/A | N/A |
| Italy | 3,313.419 | 2,914.356 | -12.04% |
| Latvia | N/A | N/A | N/A |
| Lithuania | N/A | 1.598 | N/A |
| Luxembourg | 28.227 | 21.914 | -22.37% |
| Malta | N/A | N/A | N/A |
| Netherlands | N/A | N/A | N/A |
| Poland | 399.168 | 291.719 | -26.92% |
| Portugal | 681.589 | 616.622 | -9.53% |
| Romania | 3.676 | 3.538 | -3.77% |
| Sweden | N/A | N/A | N/A |
Electronically initiated remote transactions by country
Electronically initiated remote transactions by country
Domestic scope W2.W2 · million transactions
| Country | 2024 | 2025 | Change 2025/24 |
|---|---|---|---|
| Germany | 282.222 | 286.672 | +1.58% |
| Austria | 51.711 | 58.030 | +12.22% |
| Belgium | 167.257 | 164.054 | -1.92% |
| Bulgaria | 42.715 | 50.632 | +18.54% |
| Czechia | 143.334 | 155.803 | +8.70% |
| Cyprus | 10.150 | 9.940 | -2.07% |
| Croatia | 35.917 | 40.924 | +13.94% |
| Denmark | N/A | N/A | N/A |
| Slovakia | 46.636 | 58.876 | +26.24% |
| Slovenia | 4.465 | 4.774 | +6.92% |
| Spain | 854.526 | 940.499 | +10.06% |
| Estonia | 9.327 | 9.354 | +0.29% |
| Finland | 73.590 | 73.771 | +0.25% |
| France | 2,222.553 | 2,438.401 | +9.71% |
| Greece | 270.039 | 290.286 | +7.50% |
| Hungary | 154.530 | 159.648 | +3.31% |
| Ireland | 285.902 | 315.710 | +10.43% |
| Italy | 384.777 | 386.517 | +0.45% |
| Latvia | 9.695 | 13.294 | +37.12% |
| Lithuania | N/A | 17.966 | N/A |
| Luxembourg | 12.349 | 9.543 | -22.72% |
| Malta | 5.148 | 4.373 | -15.06% |
| Netherlands | 75.406 | 76.385 | +1.30% |
| Poland | 265.647 | 291.234 | +9.63% |
| Portugal | 1,115.042 | 909.461 | -18.44% |
| Romania | 239.725 | 334.627 | +39.59% |
| Sweden | N/A | N/A | N/A |
Value of electronically initiated remote payments by country
Value of electronically initiated remote payments by country
Domestic scope W2.W2 · € million
| Country | 2024 | 2025 | Change 2025/24 |
|---|---|---|---|
| Germany | 27,233.641 | 25,274.277 | -7.19% |
| Austria | 3,283.986 | 3,325.656 | +1.27% |
| Belgium | 9,046.761 | 9,104.026 | +0.63% |
| Bulgaria | 2,144.129 | 2,750.493 | +28.28% |
| Czechia | 5,228.440 | 5,770.524 | +10.37% |
| Cyprus | 2,256.816 | 2,429.408 | +7.65% |
| Croatia | 1,715.593 | 1,973.722 | +15.05% |
| Denmark | N/A | N/A | N/A |
| Slovakia | 1,626.651 | 2,042.804 | +25.58% |
| Slovenia | 252.650 | 286.845 | +13.53% |
| Spain | 45,563.832 | 51,689.063 | +13.44% |
| Estonia | 183.006 | 173.579 | -5.15% |
| Finland | 3,166.604 | 3,050.511 | -3.67% |
| France | 148,632.250 | 162,935.066 | +9.62% |
| Greece | 11,135.224 | 12,337.664 | +10.80% |
| Hungary | 6,991.086 | 7,990.717 | +14.30% |
| Ireland | 19,401.399 | 21,984.959 | +13.32% |
| Italy | 24,256.215 | 25,109.313 | +3.52% |
| Latvia | 190.525 | 219.878 | +15.41% |
| Lithuania | N/A | 682.484 | N/A |
| Luxembourg | 764.815 | 573.379 | -25.03% |
| Malta | 486.371 | 462.579 | -4.89% |
| Netherlands | 7,572.014 | 7,390.723 | -2.39% |
| Poland | 8,654.575 | 10,658.359 | +23.15% |
| Portugal | 53,409.665 | 49,523.661 | -7.28% |
| Romania | 9,387.262 | 13,170.829 | +40.31% |
| Sweden | N/A | N/A | N/A |
Total CNP transactions by country
Total CNP transactions by country
Domestic scope W2.W2 · million transactions
| Country | 2024 | 2025 | Change 2025/24 |
|---|---|---|---|
| Germany | 288.309 | 292.311 | +1.39% |
| Austria | 52.658 | 58.762 | +11.59% |
| Belgium | N/A | 164.196 | N/A |
| Bulgaria | N/A | N/A | N/A |
| Czechia | 143.375 | 155.845 | +8.70% |
| Cyprus | N/A | 10.080 | N/A |
| Croatia | 42.891 | 48.903 | +14.02% |
| Denmark | N/A | N/A | N/A |
| Slovakia | 46.717 | 58.964 | +26.21% |
| Slovenia | 4.465 | 4.774 | +6.92% |
| Spain | 919.252 | 1,000.224 | +8.81% |
| Estonia | 9.335 | 9.370 | +0.37% |
| Finland | 74.313 | 74.189 | -0.17% |
| France | 2,302.212 | 2,505.544 | +8.83% |
| Greece | 273.042 | 293.395 | +7.45% |
| Hungary | 157.222 | 162.547 | +3.39% |
| Ireland | N/A | 331.675 | N/A |
| Italy | 420.761 | 421.303 | +0.13% |
| Latvia | N/A | N/A | N/A |
| Lithuania | N/A | 17.992 | N/A |
| Luxembourg | 12.880 | 9.725 | -24.50% |
| Malta | N/A | N/A | N/A |
| Netherlands | N/A | N/A | N/A |
| Poland | 274.344 | 298.476 | +8.80% |
| Portugal | 1,123.797 | 916.753 | -18.42% |
| Romania | 239.742 | 334.642 | +39.58% |
| Sweden | N/A | N/A | N/A |
Total CNP value by country
Total CNP value by country
Domestic scope W2.W2 · € million
| Country | 2024 | 2025 | Change 2025/24 |
|---|---|---|---|
| Germany | 29,993.087 | 27,876.211 | -7.06% |
| Austria | 3,516.298 | 3,523.693 | +0.21% |
| Belgium | 9,088.441 | 9,127.495 | +0.43% |
| Bulgaria | N/A | N/A | N/A |
| Czechia | 5,236.582 | 5,778.060 | +10.34% |
| Cyprus | N/A | 2,448.336 | N/A |
| Croatia | 1,933.677 | 2,242.966 | +15.99% |
| Denmark | N/A | N/A | N/A |
| Slovakia | 1,628.549 | 2,044.564 | +25.55% |
| Slovenia | 252.650 | 286.845 | +13.53% |
| Spain | 52,105.360 | 57,991.735 | +11.30% |
| Estonia | 183.147 | 174.245 | -4.86% |
| Finland | 3,195.039 | 3,066.317 | -4.03% |
| France | 160,287.282 | 171,557.995 | +7.03% |
| Greece | 11,425.174 | 12,633.639 | +10.58% |
| Hungary | 7,078.417 | 8,081.090 | +14.17% |
| Ireland | N/A | N/A | N/A |
| Italy | 27,569.635 | 28,023.670 | +1.65% |
| Latvia | N/A | N/A | N/A |
| Lithuania | N/A | 684.082 | N/A |
| Luxembourg | 793.042 | 595.293 | -24.94% |
| Malta | N/A | N/A | N/A |
| Netherlands | N/A | N/A | N/A |
| Poland | 9,053.742 | 10,950.078 | +20.95% |
| Portugal | 54,091.254 | 50,140.284 | -7.30% |
| Romania | 9,390.939 | 13,174.367 | +40.29% |
| Sweden | N/A | N/A | N/A |
MOTO share of CNP transactions by country
MOTO share of CNP transactions by country
Domestic scope W2.W2 · percentage
| Country | 2024 | 2025 | Change 2025/24 |
|---|---|---|---|
| Germany | 2.11 | 1.93 | -0.18 pp |
| Austria | 1.80 | 1.25 | -0.55 pp |
| Belgium | N/A | 0.09 | N/A |
| Bulgaria | N/A | N/A | N/A |
| Czechia | 0.03 | 0.03 | -0.00 pp |
| Cyprus | N/A | 1.39 | N/A |
| Croatia | 16.26 | 16.32 | +0.05 pp |
| Denmark | N/A | N/A | N/A |
| Slovakia | 0.17 | 0.15 | -0.02 pp |
| Slovenia | 0.00 | 0.00 | 0.00 pp |
| Spain | 7.04 | 5.97 | -1.07 pp |
| Estonia | 0.09 | 0.17 | +0.08 pp |
| Finland | 0.97 | 0.56 | -0.41 pp |
| France | 3.46 | 2.68 | -0.78 pp |
| Greece | 1.10 | 1.06 | -0.04 pp |
| Hungary | 1.71 | 1.78 | +0.07 pp |
| Ireland | N/A | 4.81 | N/A |
| Italy | 8.55 | 8.26 | -0.30 pp |
| Latvia | N/A | N/A | N/A |
| Lithuania | N/A | 0.14 | N/A |
| Luxembourg | 4.13 | 1.87 | -2.26 pp |
| Malta | N/A | N/A | N/A |
| Netherlands | N/A | N/A | N/A |
| Poland | 3.17 | 2.43 | -0.74 pp |
| Portugal | 0.78 | 0.80 | +0.02 pp |
| Romania | 0.01 | 0.00 | -0.00 pp |
| Sweden | N/A | N/A | N/A |
MOTO share of CNP value by country
MOTO share of CNP value by country
Domestic scope W2.W2 · percentage
| Country | 2024 | 2025 | Change 2025/24 |
|---|---|---|---|
| Germany | 9.20 | 9.33 | +0.13 pp |
| Austria | 6.61 | 5.62 | -0.99 pp |
| Belgium | 0.46 | 0.26 | -0.20 pp |
| Bulgaria | N/A | N/A | N/A |
| Czechia | 0.16 | 0.13 | -0.03 pp |
| Cyprus | N/A | 0.77 | N/A |
| Croatia | 11.28 | 12.00 | +0.73 pp |
| Denmark | N/A | N/A | N/A |
| Slovakia | 0.12 | 0.09 | -0.03 pp |
| Slovenia | 0.00 | 0.00 | 0.00 pp |
| Spain | 12.55 | 10.87 | -1.69 pp |
| Estonia | 0.08 | 0.38 | +0.31 pp |
| Finland | 0.89 | 0.52 | -0.37 pp |
| France | 7.27 | 5.03 | -2.25 pp |
| Greece | 2.54 | 2.34 | -0.20 pp |
| Hungary | 1.23 | 1.12 | -0.12 pp |
| Ireland | N/A | N/A | N/A |
| Italy | 12.02 | 10.40 | -1.62 pp |
| Latvia | N/A | N/A | N/A |
| Lithuania | N/A | 0.23 | N/A |
| Luxembourg | 3.56 | 3.68 | +0.12 pp |
| Malta | N/A | N/A | N/A |
| Netherlands | N/A | N/A | N/A |
| Poland | 4.41 | 2.66 | -1.74 pp |
| Portugal | 1.26 | 1.23 | -0.03 pp |
| Romania | 0.04 | 0.03 | -0.01 pp |
| Sweden | N/A | N/A | N/A |
Average MOTO ticket by country
Average MOTO ticket by country
Domestic scope W2.W2 · € per transaction
| Country | 2024 | 2025 | Change 2025/24 |
|---|---|---|---|
| Germany | 453.39 | 461.43 | +1.78% |
| Austria | 245.50 | 270.69 | +10.26% |
| Belgium | N/A | 165.79 | N/A |
| Bulgaria | N/A | N/A | N/A |
| Czechia | 198.01 | 180.25 | -8.97% |
| Cyprus | N/A | 134.67 | N/A |
| Croatia | 31.27 | 33.74 | +7.92% |
| Denmark | N/A | N/A | N/A |
| Slovakia | 23.44 | 20.02 | -14.59% |
| Slovenia | N/C | N/C | N/A |
| Spain | 101.06 | 105.53 | +4.42% |
| Estonia | 16.73 | 42.26 | +152.68% |
| Finland | 39.34 | 37.87 | -3.73% |
| France | 146.31 | 128.43 | -12.22% |
| Greece | 96.57 | 95.18 | -1.44% |
| Hungary | 32.45 | 31.18 | -3.91% |
| Ireland | N/A | N/A | N/A |
| Italy | 92.08 | 83.78 | -9.01% |
| Latvia | N/A | N/A | N/A |
| Lithuania | N/A | 61.49 | N/A |
| Luxembourg | 53.08 | 120.49 | +127.00% |
| Malta | N/A | N/A | N/A |
| Netherlands | N/A | N/A | N/A |
| Poland | 45.90 | 40.29 | -12.22% |
| Portugal | 77.85 | 84.56 | +8.62% |
| Romania | 213.52 | 245.22 | +14.85% |
| Sweden | N/A | N/A | N/A |
7. Full EU country tables — worldwide issuer scope W0.W0
W0.W0 attributes transactions to the country of residence of the issuer, irrespective of where the counterparty, acquirer or merchant is located. For assessing the broader market associated with cards issued in each country, this is the more complete issuer-side perspective.MOTO transactions by country
MOTO transactions by country
Worldwide issuer scope W0.W0 · million transactions · 2024 vs 2025
| Country | 2024 | 2025 | Change 2025/24 |
|---|---|---|---|
| Germany | 39.106 | 36.699 | -6.15% |
| Austria | 3.744 | 3.223 | -13.92% |
| Belgium | 12.692 | 13.327 | +5.00% |
| Bulgaria | 1.402 | 1.670 | +19.17% |
| Czechia | 0.502 | 0.648 | +29.11% |
| Cyprus | 0.809 | 0.427 | -47.20% |
| Croatia | 8.183 | 10.091 | +23.31% |
| Denmark | N/A | N/A | N/A |
| Slovakia | 2.088 | 1.425 | -31.77% |
| Slovenia | 0.004 | 0.002 | -49.06% |
| Spain | 93.692 | 89.580 | -4.39% |
| Estonia | 0.093 | 0.103 | +11.11% |
| Finland | 5.822 | 5.454 | -6.31% |
| France | 179.345 | 169.038 | -5.75% |
| Greece | 4.907 | 4.721 | -3.79% |
| Hungary | 3.450 | 3.515 | +1.89% |
| Ireland | 36.471 | 39.211 | +7.51% |
| Italy | 147.927 | 169.752 | +14.75% |
| Latvia | 0.478 | 0.623 | +30.38% |
| Lithuania | 0.190 | 0.191 | +0.77% |
| Luxembourg | 4.366 | 3.675 | -15.83% |
| Malta | N/A | N/A | N/A |
| Netherlands | N/A | N/A | N/A |
| Poland | 28.177 | 20.122 | -28.59% |
| Portugal | 87.803 | 72.882 | -16.99% |
| Romania | 0.618 | 0.411 | -33.46% |
| Sweden | N/A | N/A | N/A |
MOTO value by country
MOTO value by country
Worldwide issuer scope W0.W0 · € million · 2024 vs 2025
| Country | 2024 | 2025 | Change 2025/24 |
|---|---|---|---|
| Germany | 7,871.990 | 6,981.676 | -11.31% |
| Austria | 701.479 | 638.731 | -8.95% |
| Belgium | 772.714 | 561.443 | -27.34% |
| Bulgaria | 86.198 | 100.600 | +16.71% |
| Czechia | 81.426 | 94.292 | +15.80% |
| Cyprus | 109.392 | 58.498 | -46.52% |
| Croatia | 287.989 | 346.710 | +20.39% |
| Denmark | N/A | N/A | N/A |
| Slovakia | 45.903 | 39.948 | -12.97% |
| Slovenia | 1.451 | 0.362 | -75.03% |
| Spain | 8,437.109 | 8,363.402 | -0.87% |
| Estonia | 5.083 | 5.733 | +12.79% |
| Finland | 160.763 | 133.459 | -16.98% |
| France | 15,609.813 | 12,471.880 | -20.10% |
| Greece | 482.475 | 520.972 | +7.98% |
| Hungary | 158.086 | 154.181 | -2.47% |
| Ireland | 11,729.690 | 13,181.182 | +12.37% |
| Italy | 7,850.017 | 8,035.418 | +2.36% |
| Latvia | 43.583 | 25.262 | -42.04% |
| Lithuania | 44.446 | 39.325 | -11.52% |
| Luxembourg | 348.904 | 428.123 | +22.70% |
| Malta | N/A | N/A | N/A |
| Netherlands | N/A | N/A | N/A |
| Poland | 1,032.834 | 861.412 | -16.60% |
| Portugal | 4,008.805 | 3,672.870 | -8.38% |
| Romania | 33.299 | 28.627 | -14.03% |
| Sweden | N/A | N/A | N/A |
Electronically initiated remote transactions by country
Electronically initiated remote transactions by country
Worldwide issuer scope W0.W0 · million transactions
| Country | 2024 | 2025 | Change 2025/24 |
|---|---|---|---|
| Germany | 1,465.773 | 1,776.012 | +21.17% |
| Austria | 354.397 | 419.909 | +18.49% |
| Belgium | 753.775 | 881.658 | +16.97% |
| Bulgaria | 131.471 | 166.931 | +26.97% |
| Czechia | 553.815 | 662.624 | +19.65% |
| Cyprus | 65.912 | 75.915 | +15.18% |
| Croatia | 104.782 | 132.076 | +26.05% |
| Denmark | N/A | N/A | N/A |
| Slovakia | 191.339 | 235.131 | +22.89% |
| Slovenia | 48.521 | 55.547 | +14.48% |
| Spain | 2,030.295 | 2,384.859 | +17.46% |
| Estonia | 71.376 | 86.838 | +21.66% |
| Finland | 431.962 | 510.726 | +18.23% |
| France | 4,008.237 | 4,535.923 | +13.17% |
| Greece | 493.987 | 572.178 | +15.83% |
| Hungary | 363.078 | 414.815 | +14.25% |
| Ireland | 853.113 | 1,004.246 | +17.72% |
| Italy | 1,210.033 | 1,443.432 | +19.29% |
| Latvia | 76.314 | 85.164 | +11.60% |
| Lithuania | 854.635 | 965.111 | +12.93% |
| Luxembourg | 104.736 | 118.277 | +12.93% |
| Malta | 43.602 | 59.877 | +37.33% |
| Netherlands | 276.359 | 333.488 | +20.67% |
| Poland | 901.182 | 1,071.052 | +18.85% |
| Portugal | 1,178.743 | 995.642 | -15.53% |
| Romania | 597.810 | 900.171 | +50.58% |
| Sweden | N/A | N/A | N/A |
Value of electronically initiated remote payments by country
Value of electronically initiated remote payments by country
Worldwide issuer scope W0.W0 · € million
| Country | 2024 | 2025 | Change 2025/24 |
|---|---|---|---|
| Germany | 110,581.496 | 126,841.330 | +14.70% |
| Austria | 21,452.397 | 25,031.228 | +16.68% |
| Belgium | 50,138.193 | 57,894.279 | +15.47% |
| Bulgaria | 8,116.284 | 10,466.355 | +28.96% |
| Czechia | 22,966.123 | 28,190.733 | +22.75% |
| Cyprus | 8,128.134 | 9,647.561 | +18.69% |
| Croatia | 5,585.432 | 7,342.651 | +31.46% |
| Denmark | N/A | N/A | N/A |
| Slovakia | 8,012.186 | 9,742.811 | +21.60% |
| Slovenia | 2,877.414 | 3,138.533 | +9.07% |
| Spain | 97,786.808 | 116,058.418 | +18.69% |
| Estonia | 2,627.344 | 3,531.445 | +34.41% |
| Finland | 17,138.831 | 20,198.612 | +17.85% |
| France | 241,673.421 | 269,048.857 | +11.33% |
| Greece | 20,010.406 | 23,906.077 | +19.47% |
| Hungary | 15,827.712 | 21,608.858 | +36.53% |
| Ireland | 79,420.585 | 106,732.495 | +34.39% |
| Italy | 68,074.440 | 81,517.415 | +19.75% |
| Latvia | 2,609.735 | 2,992.701 | +14.67% |
| Lithuania | 34,559.127 | 43,417.745 | +25.63% |
| Luxembourg | 8,050.672 | 9,155.483 | +13.72% |
| Malta | 4,674.928 | 7,082.977 | +51.51% |
| Netherlands | 22,071.789 | 26,532.094 | +20.21% |
| Poland | 31,825.708 | 39,943.294 | +25.51% |
| Portugal | 56,331.252 | 53,051.716 | -5.82% |
| Romania | 25,751.016 | 36,113.025 | +40.24% |
| Sweden | N/A | N/A | N/A |
Total CNP transactions by country
Total CNP transactions by country
Worldwide issuer scope W0.W0 · million transactions
| Country | 2024 | 2025 | Change 2025/24 |
|---|---|---|---|
| Germany | 1,504.879 | 1,812.711 | +20.46% |
| Austria | 358.141 | 423.132 | +18.15% |
| Belgium | 766.467 | 894.985 | +16.77% |
| Bulgaria | 132.873 | 168.601 | +26.89% |
| Czechia | 554.317 | 663.272 | +19.66% |
| Cyprus | 66.720 | 76.342 | +14.42% |
| Croatia | 112.966 | 142.167 | +25.85% |
| Denmark | N/A | N/A | N/A |
| Slovakia | 193.427 | 236.556 | +22.30% |
| Slovenia | 48.525 | 55.549 | +14.48% |
| Spain | 2,123.987 | 2,474.439 | +16.50% |
| Estonia | 71.469 | 86.941 | +21.65% |
| Finland | 437.784 | 516.181 | +17.91% |
| France | 4,187.582 | 4,704.961 | +12.36% |
| Greece | 498.894 | 576.898 | +15.64% |
| Hungary | 366.528 | 418.330 | +14.13% |
| Ireland | 889.584 | 1,043.458 | +17.30% |
| Italy | 1,357.961 | 1,613.185 | +18.79% |
| Latvia | 76.791 | 85.787 | +11.71% |
| Lithuania | 854.824 | 965.302 | +12.92% |
| Luxembourg | 109.102 | 121.951 | +11.78% |
| Malta | N/A | N/A | N/A |
| Netherlands | N/A | N/A | N/A |
| Poland | 929.359 | 1,091.175 | +17.41% |
| Portugal | 1,266.547 | 1,068.524 | -15.63% |
| Romania | 598.428 | 900.582 | +50.49% |
| Sweden | N/A | N/A | N/A |
Total CNP value by country
Total CNP value by country
Worldwide issuer scope W0.W0 · € million
| Country | 2024 | 2025 | Change 2025/24 |
|---|---|---|---|
| Germany | 118,453.486 | 133,823.006 | +12.98% |
| Austria | 22,153.876 | 25,669.959 | +15.87% |
| Belgium | 50,910.907 | 58,455.722 | +14.82% |
| Bulgaria | 8,202.482 | 10,566.955 | +28.83% |
| Czechia | 23,047.549 | 28,285.025 | +22.72% |
| Cyprus | 8,237.526 | 9,706.059 | +17.83% |
| Croatia | 5,873.421 | 7,689.361 | +30.92% |
| Denmark | N/A | N/A | N/A |
| Slovakia | 8,058.090 | 9,782.759 | +21.40% |
| Slovenia | 2,878.865 | 3,138.895 | +9.03% |
| Spain | 106,223.917 | 124,421.820 | +17.13% |
| Estonia | 2,632.427 | 3,537.178 | +34.37% |
| Finland | 17,299.595 | 20,332.071 | +17.53% |
| France | 257,283.233 | 281,520.737 | +9.42% |
| Greece | 20,492.880 | 24,427.049 | +19.20% |
| Hungary | 15,985.797 | 21,763.039 | +36.14% |
| Ireland | 91,150.276 | 119,913.677 | +31.56% |
| Italy | 75,924.457 | 89,552.833 | +17.95% |
| Latvia | 2,653.318 | 3,017.964 | +13.74% |
| Lithuania | 34,603.573 | 43,457.070 | +25.59% |
| Luxembourg | 8,399.576 | 9,583.606 | +14.10% |
| Malta | N/A | N/A | N/A |
| Netherlands | N/A | N/A | N/A |
| Poland | 32,858.542 | 40,804.705 | +24.18% |
| Portugal | 60,340.057 | 56,724.586 | -5.99% |
| Romania | 25,784.315 | 36,141.652 | +40.17% |
| Sweden | N/A | N/A | N/A |
MOTO share of CNP transactions by country
MOTO share of CNP transactions by country
Worldwide issuer scope W0.W0 · percentage
| Country | 2024 | 2025 | Change 2025/24 |
|---|---|---|---|
| Germany | 2.60 | 2.02 | -0.57 pp |
| Austria | 1.05 | 0.76 | -0.28 pp |
| Belgium | 1.66 | 1.49 | -0.17 pp |
| Bulgaria | 1.05 | 0.99 | -0.06 pp |
| Czechia | 0.09 | 0.10 | +0.01 pp |
| Cyprus | 1.21 | 0.56 | -0.65 pp |
| Croatia | 7.24 | 7.10 | -0.15 pp |
| Denmark | N/A | N/A | N/A |
| Slovakia | 1.08 | 0.60 | -0.48 pp |
| Slovenia | 0.01 | 0.00 | -0.00 pp |
| Spain | 4.41 | 3.62 | -0.79 pp |
| Estonia | 0.13 | 0.12 | -0.01 pp |
| Finland | 1.33 | 1.06 | -0.27 pp |
| France | 4.28 | 3.59 | -0.69 pp |
| Greece | 0.98 | 0.82 | -0.17 pp |
| Hungary | 0.94 | 0.84 | -0.10 pp |
| Ireland | 4.10 | 3.76 | -0.34 pp |
| Italy | 10.89 | 10.52 | -0.37 pp |
| Latvia | 0.62 | 0.73 | +0.10 pp |
| Lithuania | 0.02 | 0.02 | -0.00 pp |
| Luxembourg | 4.00 | 3.01 | -0.99 pp |
| Malta | N/A | N/A | N/A |
| Netherlands | N/A | N/A | N/A |
| Poland | 3.03 | 1.84 | -1.19 pp |
| Portugal | 6.93 | 6.82 | -0.11 pp |
| Romania | 0.10 | 0.05 | -0.06 pp |
| Sweden | N/A | N/A | N/A |
MOTO share of CNP value by country
MOTO share of CNP value by country
Worldwide issuer scope W0.W0 · percentage
| Country | 2024 | 2025 | Change 2025/24 |
|---|---|---|---|
| Germany | 6.65 | 5.22 | -1.43 pp |
| Austria | 3.17 | 2.49 | -0.68 pp |
| Belgium | 1.52 | 0.96 | -0.56 pp |
| Bulgaria | 1.05 | 0.95 | -0.10 pp |
| Czechia | 0.35 | 0.33 | -0.02 pp |
| Cyprus | 1.33 | 0.60 | -0.73 pp |
| Croatia | 4.90 | 4.51 | -0.39 pp |
| Denmark | N/A | N/A | N/A |
| Slovakia | 0.57 | 0.41 | -0.16 pp |
| Slovenia | 0.05 | 0.01 | -0.04 pp |
| Spain | 7.94 | 6.72 | -1.22 pp |
| Estonia | 0.19 | 0.16 | -0.03 pp |
| Finland | 0.93 | 0.66 | -0.27 pp |
| France | 6.07 | 4.43 | -1.64 pp |
| Greece | 2.35 | 2.13 | -0.22 pp |
| Hungary | 0.99 | 0.71 | -0.28 pp |
| Ireland | 12.87 | 10.99 | -1.88 pp |
| Italy | 10.34 | 8.97 | -1.37 pp |
| Latvia | 1.64 | 0.84 | -0.81 pp |
| Lithuania | 0.13 | 0.09 | -0.04 pp |
| Luxembourg | 4.15 | 4.47 | +0.31 pp |
| Malta | N/A | N/A | N/A |
| Netherlands | N/A | N/A | N/A |
| Poland | 3.14 | 2.11 | -1.03 pp |
| Portugal | 6.64 | 6.47 | -0.17 pp |
| Romania | 0.13 | 0.08 | -0.05 pp |
| Sweden | N/A | N/A | N/A |
Average MOTO ticket by country
Average MOTO ticket by country
Worldwide issuer scope W0.W0 · € per transaction
| Country | 2024 | 2025 | Change 2025/24 |
|---|---|---|---|
| Germany | 201.30 | 190.24 | -5.49% |
| Austria | 187.37 | 198.20 | +5.78% |
| Belgium | 60.88 | 42.13 | -30.80% |
| Bulgaria | 61.50 | 60.23 | -2.07% |
| Czechia | 162.14 | 145.43 | -10.31% |
| Cyprus | 135.28 | 137.02 | +1.29% |
| Croatia | 35.19 | 34.36 | -2.36% |
| Denmark | N/A | N/A | N/A |
| Slovakia | 21.99 | 28.04 | +27.54% |
| Slovenia | 350.49 | 171.79 | -50.99% |
| Spain | 90.05 | 93.36 | +3.68% |
| Estonia | 54.68 | 55.51 | +1.52% |
| Finland | 27.61 | 24.47 | -11.39% |
| France | 87.04 | 73.78 | -15.23% |
| Greece | 98.33 | 110.36 | +12.24% |
| Hungary | 45.83 | 43.87 | -4.28% |
| Ireland | 321.62 | 336.16 | +4.52% |
| Italy | 53.07 | 47.34 | -10.80% |
| Latvia | 91.26 | 40.57 | -55.54% |
| Lithuania | 234.54 | 205.92 | -12.20% |
| Luxembourg | 79.92 | 116.51 | +45.79% |
| Malta | N/A | N/A | N/A |
| Netherlands | N/A | N/A | N/A |
| Poland | 36.65 | 42.81 | +16.79% |
| Portugal | 45.66 | 50.40 | +10.38% |
| Romania | 53.87 | 69.60 | +29.20% |
| Sweden | N/A | N/A | N/A |
8. How much activity disappears if we look only at the domestic circuit?
The direct W2.W2/W0.W0 comparison reveals that the domestic view captures very different proportions of worldwide issuer-side activity from one country to another.
For example, the domestic circuit represents around 79.1% of Croatia’s W0.W0 MOTO transactions, 66.7% in Spain and 65.9% in Greece, but only 39.7% in France, 20.5% in Italy, 15.4% in Germany and 10.0% in Portugal. In countries such as Belgium, Luxembourg or Slovakia, the domestic share is lower still.
A low W2/W0 percentage does not indicate a small MOTO market. It indicates that more of the activity associated with that country’s issued cards falls outside the double-domestic perimeter.
Direct W2.W2 versus W0.W0 comparison
How much of the worldwide issuer-side MOTO market is visible in the domestic circuit in 2025
| Country | MOTO ops W2 | MOTO ops W0 | W2/W0 % | MOTO €m W2 | MOTO €m W0 | W2/W0 % |
|---|---|---|---|---|---|---|
| Germany | 5.639 | 36.699 | 15.4 | 2,601.933 | 6,981.676 | 37.3 |
| Austria | 0.732 | 3.223 | 22.7 | 198.037 | 638.731 | 31.0 |
| Belgium | 0.142 | 13.327 | 1.1 | 23.469 | 561.443 | 4.2 |
| Bulgaria | N/A | 1.670 | N/A | N/A | 100.600 | N/A |
| Czechia | 0.042 | 0.648 | 6.4 | 7.536 | 94.292 | 8.0 |
| Cyprus | 0.141 | 0.427 | 32.9 | 18.928 | 58.498 | 32.4 |
| Croatia | 7.979 | 10.091 | 79.1 | 269.244 | 346.710 | 77.7 |
| Denmark | N/A | N/A | N/A | N/A | N/A | N/A |
| Slovakia | 0.088 | 1.425 | 6.2 | 1.760 | 39.948 | 4.4 |
| Slovenia | 0.000 | 0.002 | 0.0 | 0.000 | 0.362 | 0.0 |
| Spain | 59.725 | 89.580 | 66.7 | 6,302.672 | 8,363.402 | 75.4 |
| Estonia | 0.016 | 0.103 | 15.3 | 0.667 | 5.733 | 11.6 |
| Finland | 0.417 | 5.454 | 7.7 | 15.806 | 133.459 | 11.8 |
| France | 67.143 | 169.038 | 39.7 | 8,622.929 | 12,471.880 | 69.1 |
| Greece | 3.109 | 4.721 | 65.9 | 295.975 | 520.972 | 56.8 |
| Hungary | 2.899 | 3.515 | 82.5 | 90.374 | 154.181 | 58.6 |
| Ireland | 15.965 | 39.211 | 40.7 | N/A | 13,181.182 | N/A |
| Italy | 34.786 | 169.752 | 20.5 | 2,914.356 | 8,035.418 | 36.3 |
| Latvia | N/A | 0.623 | N/A | N/A | 25.262 | N/A |
| Lithuania | 0.026 | 0.191 | 13.6 | 1.598 | 39.325 | 4.1 |
| Luxembourg | 0.182 | 3.675 | 4.9 | 21.914 | 428.123 | 5.1 |
| Malta | N/A | N/A | N/A | N/A | N/A | N/A |
| Netherlands | N/A | N/A | N/A | N/A | N/A | N/A |
| Poland | 7.241 | 20.122 | 36.0 | 291.719 | 861.412 | 33.9 |
| Portugal | 7.292 | 72.882 | 10.0 | 616.622 | 3,672.870 | 16.8 |
| Romania | 0.014 | 0.411 | 3.5 | 3.538 | 28.627 | 12.4 |
| Sweden | N/A | N/A | N/A | N/A | N/A | N/A |
9. Ratios and tickets by perimeter: the denominator changes the story
The comparison of MOTO ratios under W2.W2 and W0.W0 demonstrates why perimeter must always be stated explicitly in regulatory or international comparisons.
Some countries have a higher domestic MOTO/CNP ratio; others have a higher worldwide ratio. The difference is driven not only by MOTO itself, but also by how strongly electronically initiated remote payments expand when cross-border activity is included in the denominator.
MOTO ratios and average ticket by perimeter
2025 comparison of W2.W2 and W0.W0
| Country | Ops % W2 | Ops % W0 | Value % W2 | Value % W0 | Ticket € W2 | Ticket € W0 |
|---|---|---|---|---|---|---|
| Germany | 1.93 | 2.02 | 9.33 | 5.22 | 461.43 | 190.24 |
| Austria | 1.25 | 0.76 | 5.62 | 2.49 | 270.69 | 198.20 |
| Belgium | 0.09 | 1.49 | 0.26 | 0.96 | 165.79 | 42.13 |
| Bulgaria | N/A | 0.99 | N/A | 0.95 | N/A | 60.23 |
| Czechia | 0.03 | 0.10 | 0.13 | 0.33 | 180.25 | 145.43 |
| Cyprus | 1.39 | 0.56 | 0.77 | 0.60 | 134.67 | 137.02 |
| Croatia | 16.32 | 7.10 | 12.00 | 4.51 | 33.74 | 34.36 |
| Denmark | N/A | N/A | N/A | N/A | N/A | N/A |
| Slovakia | 0.15 | 0.60 | 0.09 | 0.41 | 20.02 | 28.04 |
| Slovenia | 0.00 | 0.00 | 0.00 | 0.01 | N/C | 171.79 |
| Spain | 5.97 | 3.62 | 10.87 | 6.72 | 105.53 | 93.36 |
| Estonia | 0.17 | 0.12 | 0.38 | 0.16 | 42.26 | 55.51 |
| Finland | 0.56 | 1.06 | 0.52 | 0.66 | 37.87 | 24.47 |
| France | 2.68 | 3.59 | 5.03 | 4.43 | 128.43 | 73.78 |
| Greece | 1.06 | 0.82 | 2.34 | 2.13 | 95.18 | 110.36 |
| Hungary | 1.78 | 0.84 | 1.12 | 0.71 | 31.18 | 43.87 |
| Ireland | 4.81 | 3.76 | N/A | 10.99 | N/A | 336.16 |
| Italy | 8.26 | 10.52 | 10.40 | 8.97 | 83.78 | 47.34 |
| Latvia | N/A | 0.73 | N/A | 0.84 | N/A | 40.57 |
| Lithuania | 0.14 | 0.02 | 0.23 | 0.09 | 61.49 | 205.92 |
| Luxembourg | 1.87 | 3.01 | 3.68 | 4.47 | 120.49 | 116.51 |
| Malta | N/A | N/A | N/A | N/A | N/A | N/A |
| Netherlands | N/A | N/A | N/A | N/A | N/A | N/A |
| Poland | 2.43 | 1.84 | 2.66 | 2.11 | 40.29 | 42.81 |
| Portugal | 0.80 | 6.82 | 1.23 | 6.47 | 84.56 | 50.40 |
| Romania | 0.00 | 0.05 | 0.03 | 0.08 | 245.22 | 69.60 |
| Sweden | N/A | N/A | N/A | N/A | N/A | N/A |
| Spain | muestra | un | peso | MOTO | mayor | en |
10. A methodological example: Spain shows how much the perimeter can matter
Although this study is EU-wide, Spain provides a useful example of the perimeter effect because both views are available and materially different. In 2025, W2.W2 records 59.725 million MOTO transactions and €6.303 billion, while W0.W0 records 89.580 million transactions and €8.363 billion.
That is almost 50% more transactions and 32.7% more value in the worldwide issuer view. The example is important not because Spain should be treated as the centre of the analysis, but because it illustrates a methodological issue that can affect cross-country interpretation throughout Europe.
Spain as an example of the perimeter effect
2025 W2.W2 versus W0.W0 — included here as a methodological illustration
| Indicator | W2.W2 | W0.W0 | W0 vs W2 |
|---|---|---|---|
| MOTO transactions (million) | 59.725 | 89.580 | +49.99% |
| MOTO value (€ million) | 6,302.672 | 8,363.402 | +32.70% |
| Total CNP transactions (million) | 1,000.224 | 2,474.439 | +147.39% |
| Total CNP value (€ million) | 57,991.735 | 124,421.820 | +114.55% |
| MOTO share of CNP transactions | 5.97% | 3.62% | -2.35 pp |
| MOTO share of CNP value | 10.87% | 6.72% | -4.15 pp |
| Average MOTO ticket | €105.53 | €93.36 | -11.53% |
Spain detail: 2024–2025 within each perimeter
For completeness, the study also includes Spain’s annual 2024–2025 indicators under both scopes. They are retained here as a country-level methodological example within the wider EU analysis.
Spain under the domestic scope W2.W2
2024 versus 2025 — country example
| Indicator | 2024 | 2025 | Change |
|---|---|---|---|
| MOTO transactions (million) | 64.726 | 59.725 | -7.73% |
| MOTO value (€ million) | 6,541.528 | 6,302.672 | -3.65% |
| Electronically initiated remote transactions (million) | 854.526 | 940.499 | +10.06% |
| Electronically initiated remote value (€ million) | 45,563.832 | 51,689.063 | +13.44% |
| Total CNP transactions (million) | 919.252 | 1,000.224 | +8.81% |
| Total CNP value (€ million) | 52,105.360 | 57,991.735 | +11.30% |
| MOTO share of CNP transactions | 7.04% | 5.97% | -1.07 pp |
| MOTO share of CNP value | 12.55% | 10.87% | -1.69 pp |
| Average MOTO ticket | €101.06 | €105.53 | +4.42% |
Spain under the worldwide issuer scope W0.W0
2024 versus 2025 — country example
| Indicator | 2024 | 2025 | Change |
|---|---|---|---|
| MOTO transactions (million) | 93.692 | 89.580 | -4.39% |
| MOTO value (€ million) | 8,437.109 | 8,363.402 | -0.87% |
| Electronically initiated remote transactions (million) | 2,030.295 | 2,384.859 | +17.46% |
| Electronically initiated remote value (€ million) | 97,786.808 | 116,058.418 | +18.69% |
| Total CNP transactions (million) | 2,123.987 | 2,474.439 | +16.50% |
| Total CNP value (€ million) | 106,223.917 | 124,421.820 | +17.13% |
| MOTO share of CNP transactions | 4.41% | 3.62% | -0.79 pp |
| MOTO share of CNP value | 7.94% | 6.72% | -1.22 pp |
| Average MOTO ticket | €90.05 | €93.36 | +3.68% |
11. United Kingdom: the data cannot isolate MOTO
UK Finance does not publish MOTO as a standalone category in its Card Expenditure Statistics Dashboard. MOTO is included within “Chip & PIN/other”, alongside other payment types. As a result, a directly comparable UK MOTO/CNP ratio cannot be constructed from that dataset.
United Kingdom contextual reference
Card expenditure statistics; Chip & PIN/other must not be interpreted as MOTO
| Category | Q1 2025 transactions (m) | Q1 2025 value | Q1 2026 transactions (m) | Q1 2026 value |
|---|---|---|---|---|
| Total card payments | 6,110 | £213.4bn | 5,992 | £210.9bn |
| Online | 975 | £79.9bn | 991 | £79.4bn |
| Contactless | 4,498 | £71.2bn | 4,386 | £71.9bn |
| Chip & PIN/other | 637 | £62.3bn | 615 | £59.6bn |
12. United States: a useful classification benchmark, but not a like-for-like comparison
The US Federal Reserve does separate mail-order/telephone-order within remote payments. The latest detailed channel breakdown used in this study is from 2022. The Federal Reserve published 2024 top-line card figures in July 2026, but not yet the corresponding detailed remote-channel breakdown.
United States contextual reference
Federal Reserve detailed 2022 remote-payment breakdown
| Channel | Transactions | Value | Average ticket |
|---|---|---|---|
| General-purpose cards | 153.3bn | $9.76tn | $64 |
| Remote CNP payments | 55.5bn | $5.22tn | $94 |
| MOTO | 3.0bn | $0.87tn | $293 |
| Internet purchases | 37.0bn | $3.14tn | $85 |
| Recurring or instalment payments | 12.5bn | $0.69tn | $55 |
| Other remote payments | 2.9bn | $0.52tn | $179 |
In the US 2022 detailed data, MOTO represented approximately 5.4% of remote transactions but 16.7% of remote value. The published average MOTO ticket was $293, compared with $94 for total remote CNP payments. This is not directly comparable with the EU 2024–2025 dataset, but it reinforces the broader observation that MOTO can carry disproportionate economic value relative to transaction count.
13. What the EU data suggests for the payments ecosystem
Several conclusions emerge from the European dataset.
- MOTO is declining in relative share, but remains economically material. In 2025 it still represented €57.576 billion in the official EU aggregate.
- The market is structurally heterogeneous. Italy, France, Spain, Portugal, Ireland and Germany all show very different combinations of volume, value, share and average ticket.
- Cross-border activity materially changes national market estimates. W2.W2 and W0.W0 should not be used interchangeably.
- Ticket size matters. In many countries the value share of MOTO is substantially higher than its transaction-count share.
- Current statistics are not granular enough to describe the telephone-payment journey itself. Mail order and telephone order remain aggregated.
14. The next statistical step: distinguish the different MOTO journeys
For regulators, issuers, acquirers, PSPs, merchants and contact-centre operators, better granularity would make the data much more actionable.
An improved framework could distinguish at least:
- mail order;
- agent-assisted telephone payments;
- IVR payments;
- automated or AI voice journeys;
- domestic versus cross-border activity;
- authenticated versus non-authenticated transactions, where available.
For each category, transaction count, value, average ticket, fraud, disputes and chargebacks would provide a much stronger basis for policy and risk decisions.
The present study does not prove that a particular regulation is required, nor does it prove the effectiveness of any specific technology. What it does show is the scale, diversity and economic relevance of the market that those decisions need to address.
15. From legacy MOTO to authenticated telephone payments
From Pay by Call’s perspective, the strategic issue is not whether every telephone payment should simply be pushed into a web page, app or external payment link. In many sectors — insurance, travel, utilities, public services, healthcare, collections and customer service — voice remains a legitimate and necessary interaction channel.
The more relevant question is how telephone payments can evolve so that card-data protection and payer authentication are strengthened while the customer remains inside the call.
This is the context for PBC ATO — Authenticated Telephone Order, Pay by Call’s patent-pending approach combining PBC PCIaaS and PBC 3DS to bring authentication into the telephone payment journey.
A European market question, not a single-country issue
The data shows that MOTO remains a material European payment category. The challenge is to understand its different national structures and improve its security and authentication without assuming that removing the voice channel is the only possible answer.
16. Methodology and sources
Annual totals are calculated as first semester plus second semester. Annual change is 2025 divided by 2024 minus one. Changes in MOTO shares are shown in percentage points. Where a required semester is missing, the annual total and derived indicators are shown as N/A. Source precision is retained and values are rounded only for presentation.
The conceptual selection used in the analysis came from the Statistical Information Service of the Bank of Spain, response dated 11 September 2026, reference HDEST-8361. The underlying data was extracted from the European Central Bank portal and consulted on 25 September 2026. The second half of 2025 is provisional.
ECB series structures used:
- Domestic national scope: PCP.H.XX.W2.W2.CP0.1.CANAL.R.PCS_ALL._Z._X._Z.N.UNIT
- Worldwide national scope: PCP.H.XX.W0.W0.CP0.1.CANAL.R.PCS_ALL._Z._X._Z.N.UNIT
- Official EU aggregate: PCP.H.B0.W0.W0.CP0.1.CANAL.R.PCS_ALL._Z._X._Z.N.UNIT
- CHANNEL = 1000 for MOTO and 2000 for electronically initiated remote payments
- UNIT = PN for transaction count and EUR for value
Additional contextual sources: UK Finance Card Expenditure Statistics Dashboard; Federal Reserve NPIPS Detailed Data 2015–2022; Federal Reserve Top-Line Data 2015–2024.
Request the full study
This article summarises a broader Pay by Call statistical study containing the complete 2024–2025 country dataset, both W2.W2 and W0.W0 perspectives, CNP ratios, values, transaction counts, average tickets and international contextual references.
If you are a bank, PSP, acquirer, merchant, industry association, regulator, contact-centre operator or payments professional and would like the complete report, contact Pay by Call SL. We will be pleased to share this work with the industry.
Important statistical note: MOTO in the European dataset aggregates mail order and telephone order. It does not by itself identify telephone-only payments, authentication, fraud, chargebacks or SCA status. W0.W0 measures activity associated with cards issued by resident PSPs; it does not measure all MOTO sales by merchants located in a country. For the merchant/acquiring perspective, a CP0.2 view would be required.